You can’t fix what you can’t measure
Dashboards crystallize impact by aggregating key metrics across adoption, usage, and retention. While off the shelf dashboards work well at the overall product level, I often find myself having to write one-off SQL queries to track these metrics at a feature level.
The SQL queries I frequently write,
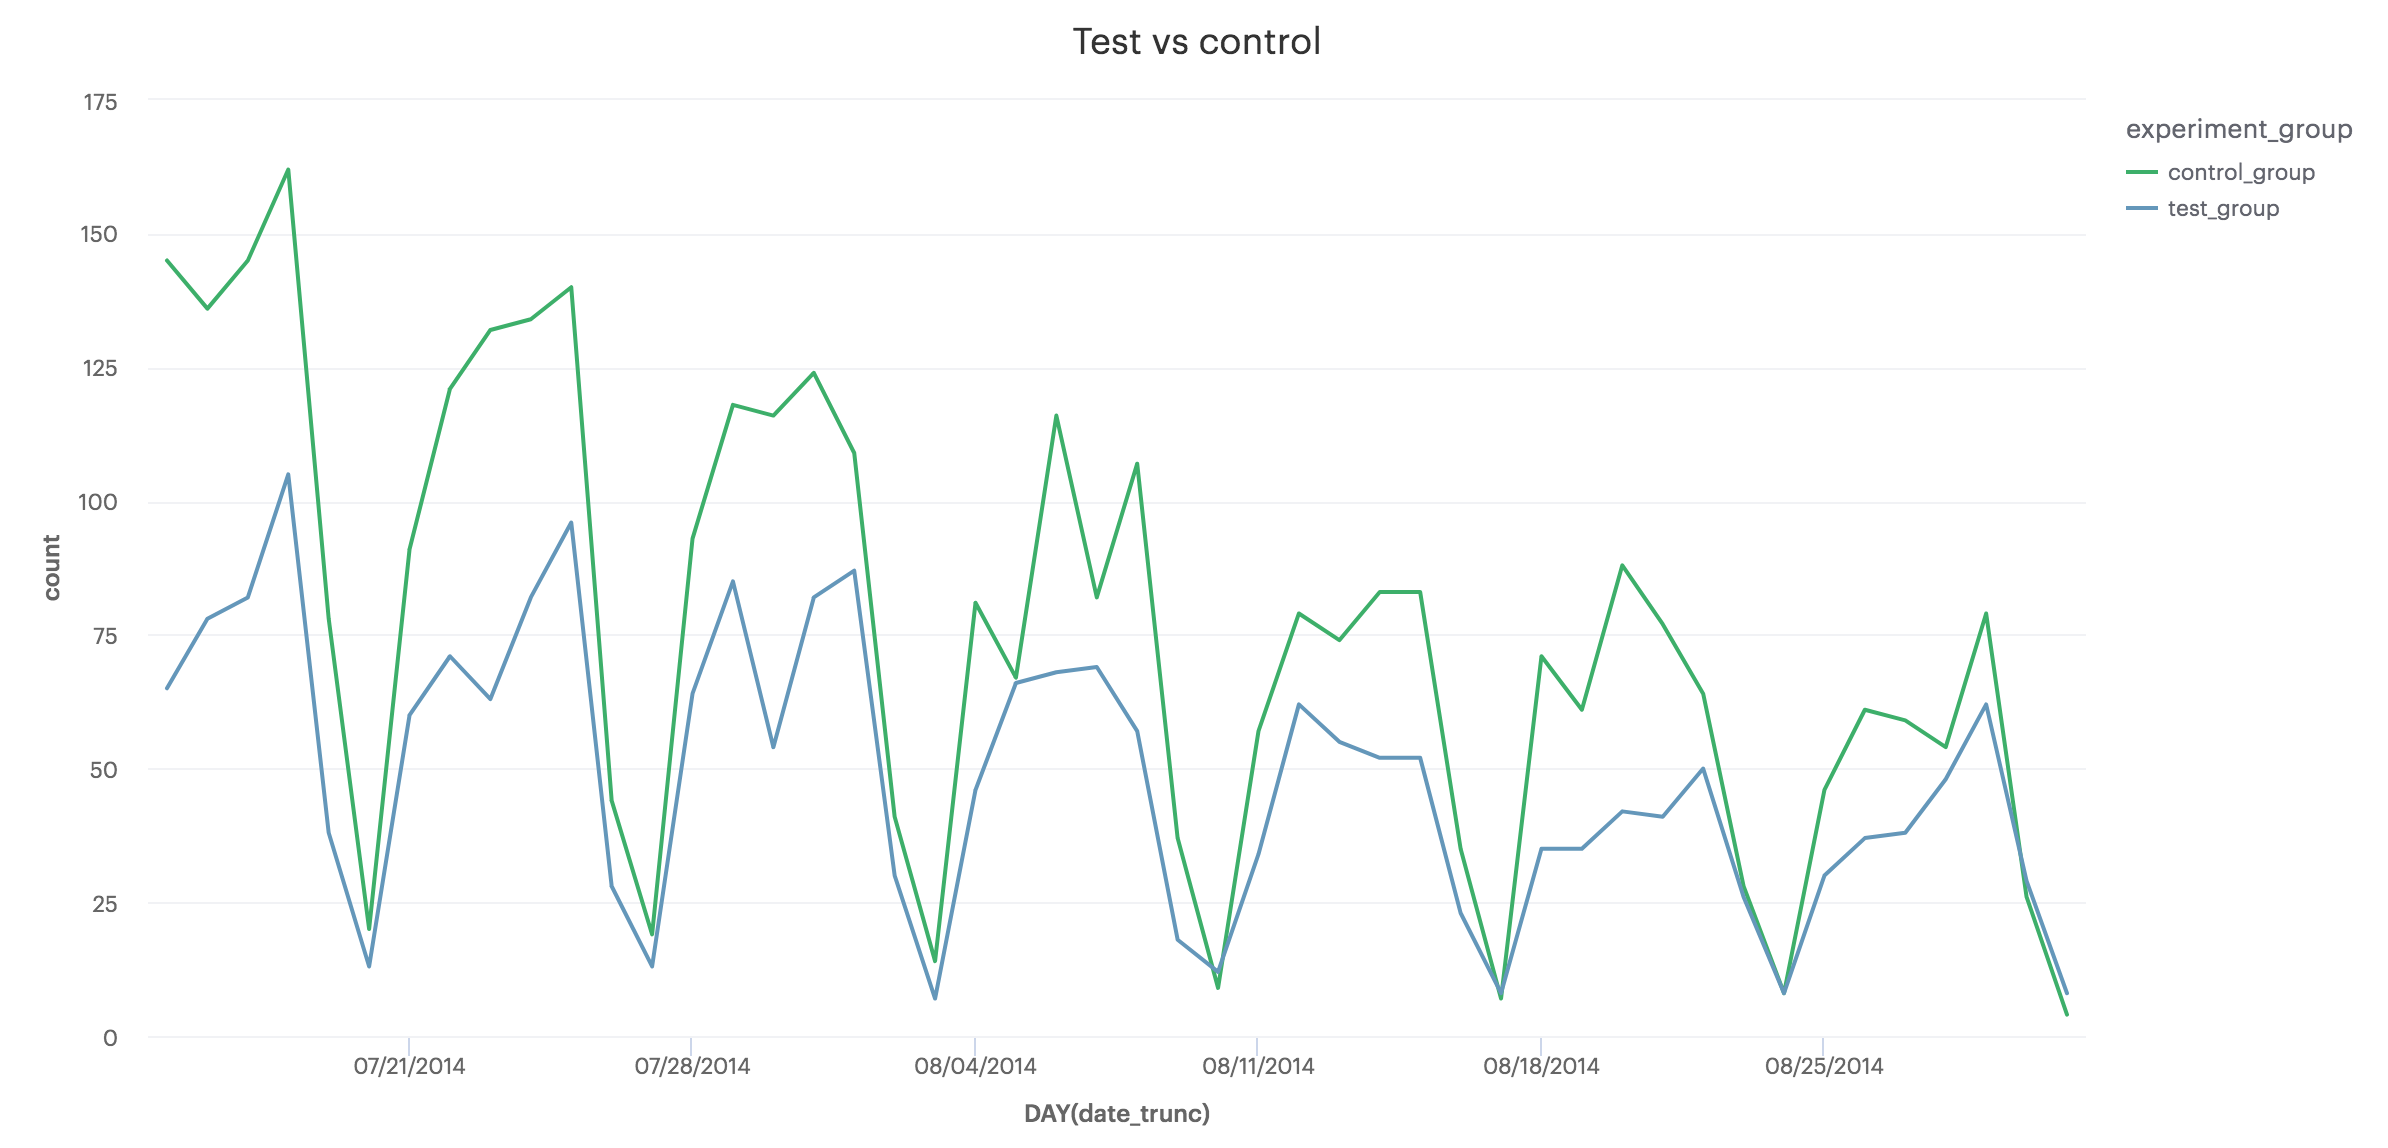
- Compare behavior across test and control groups
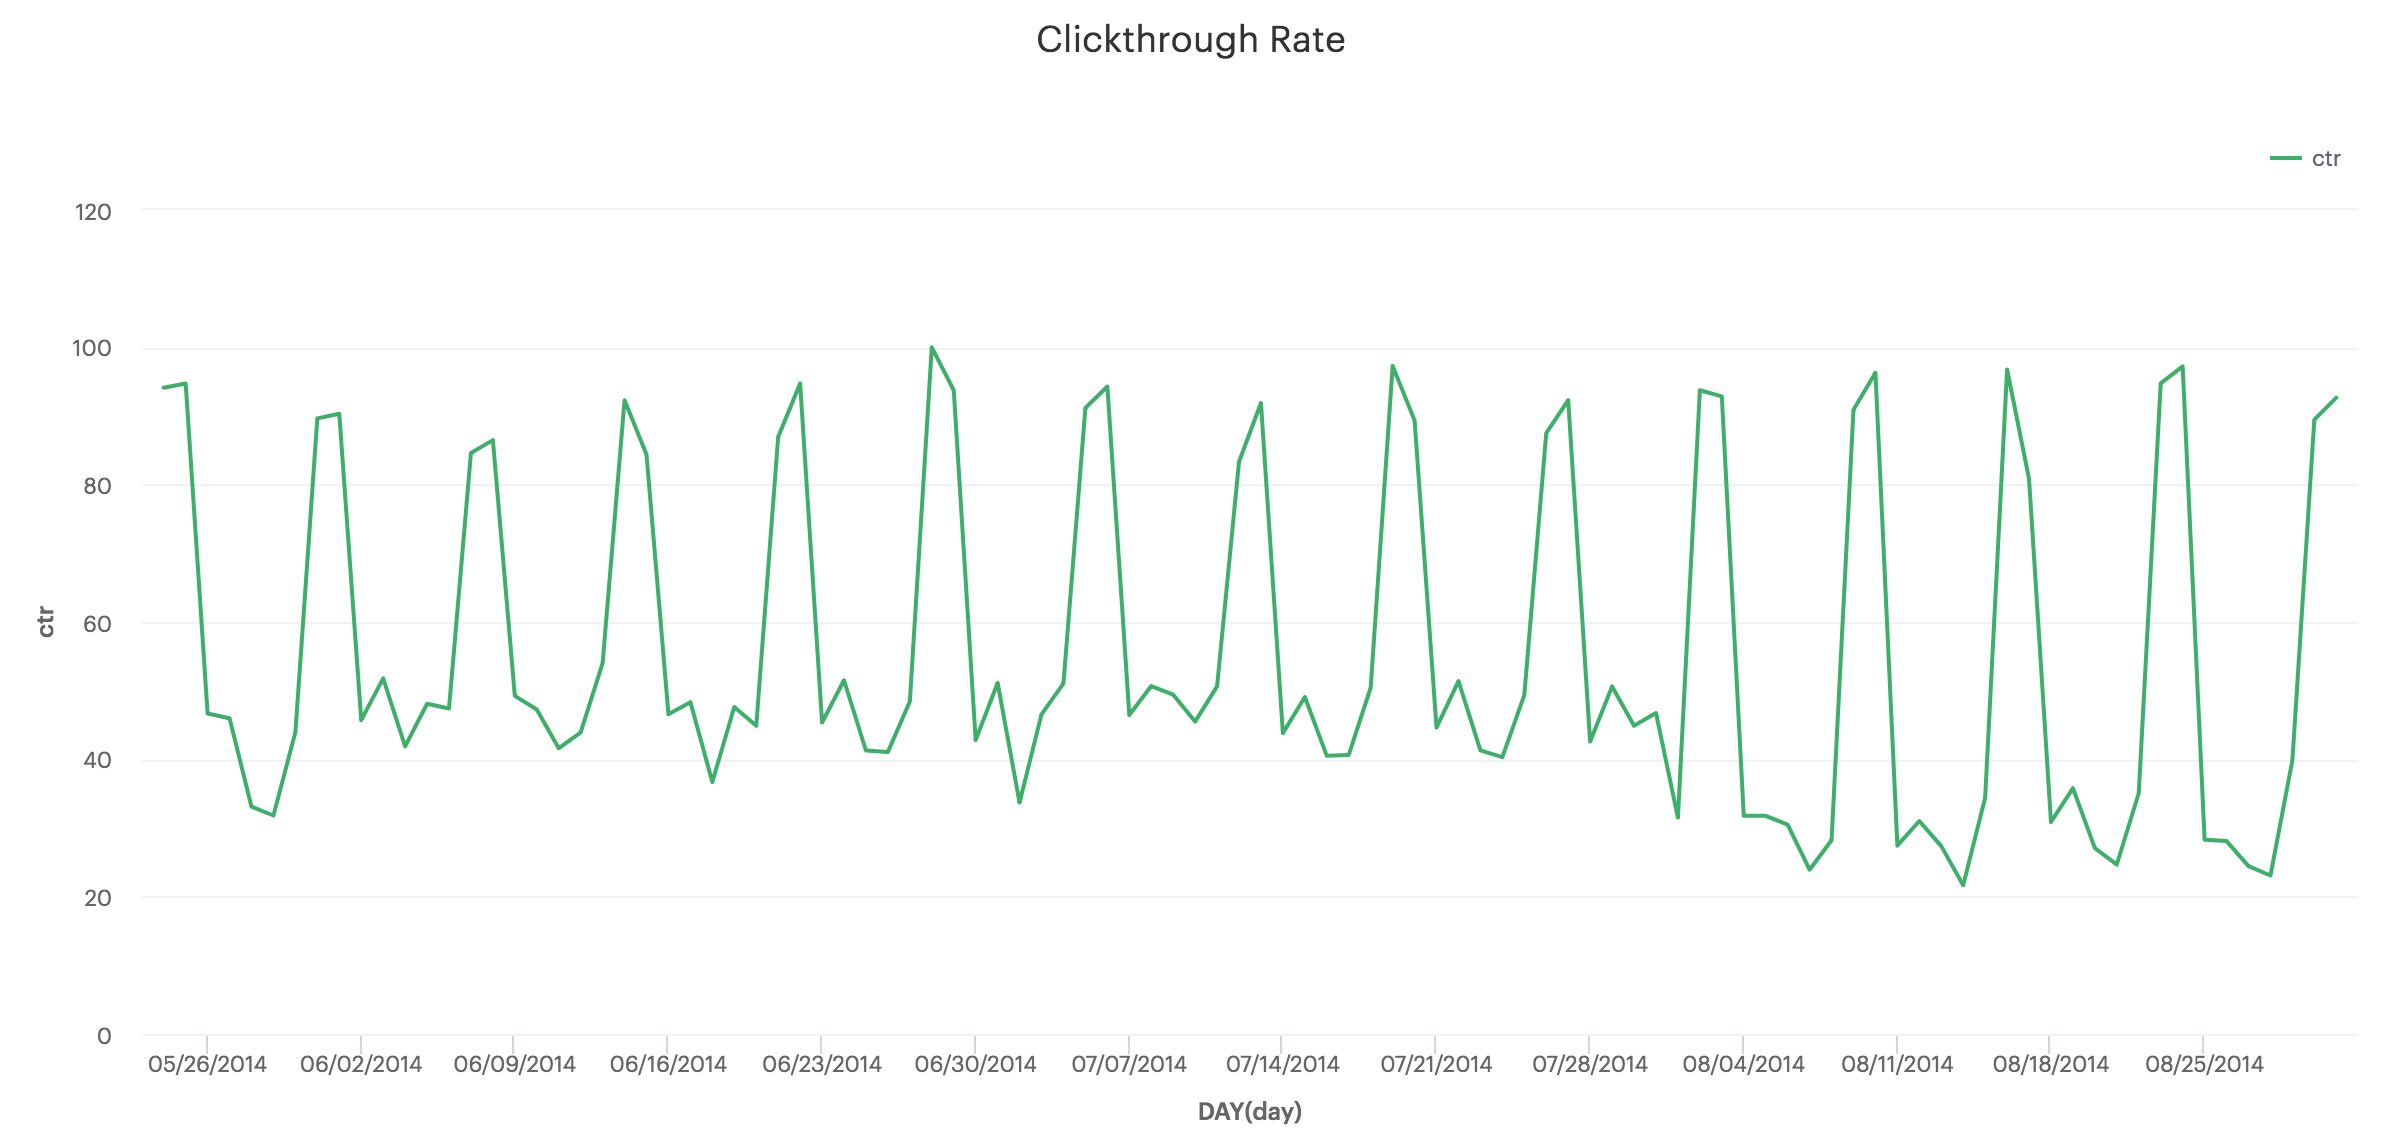
- Track click through rates to measure engagement
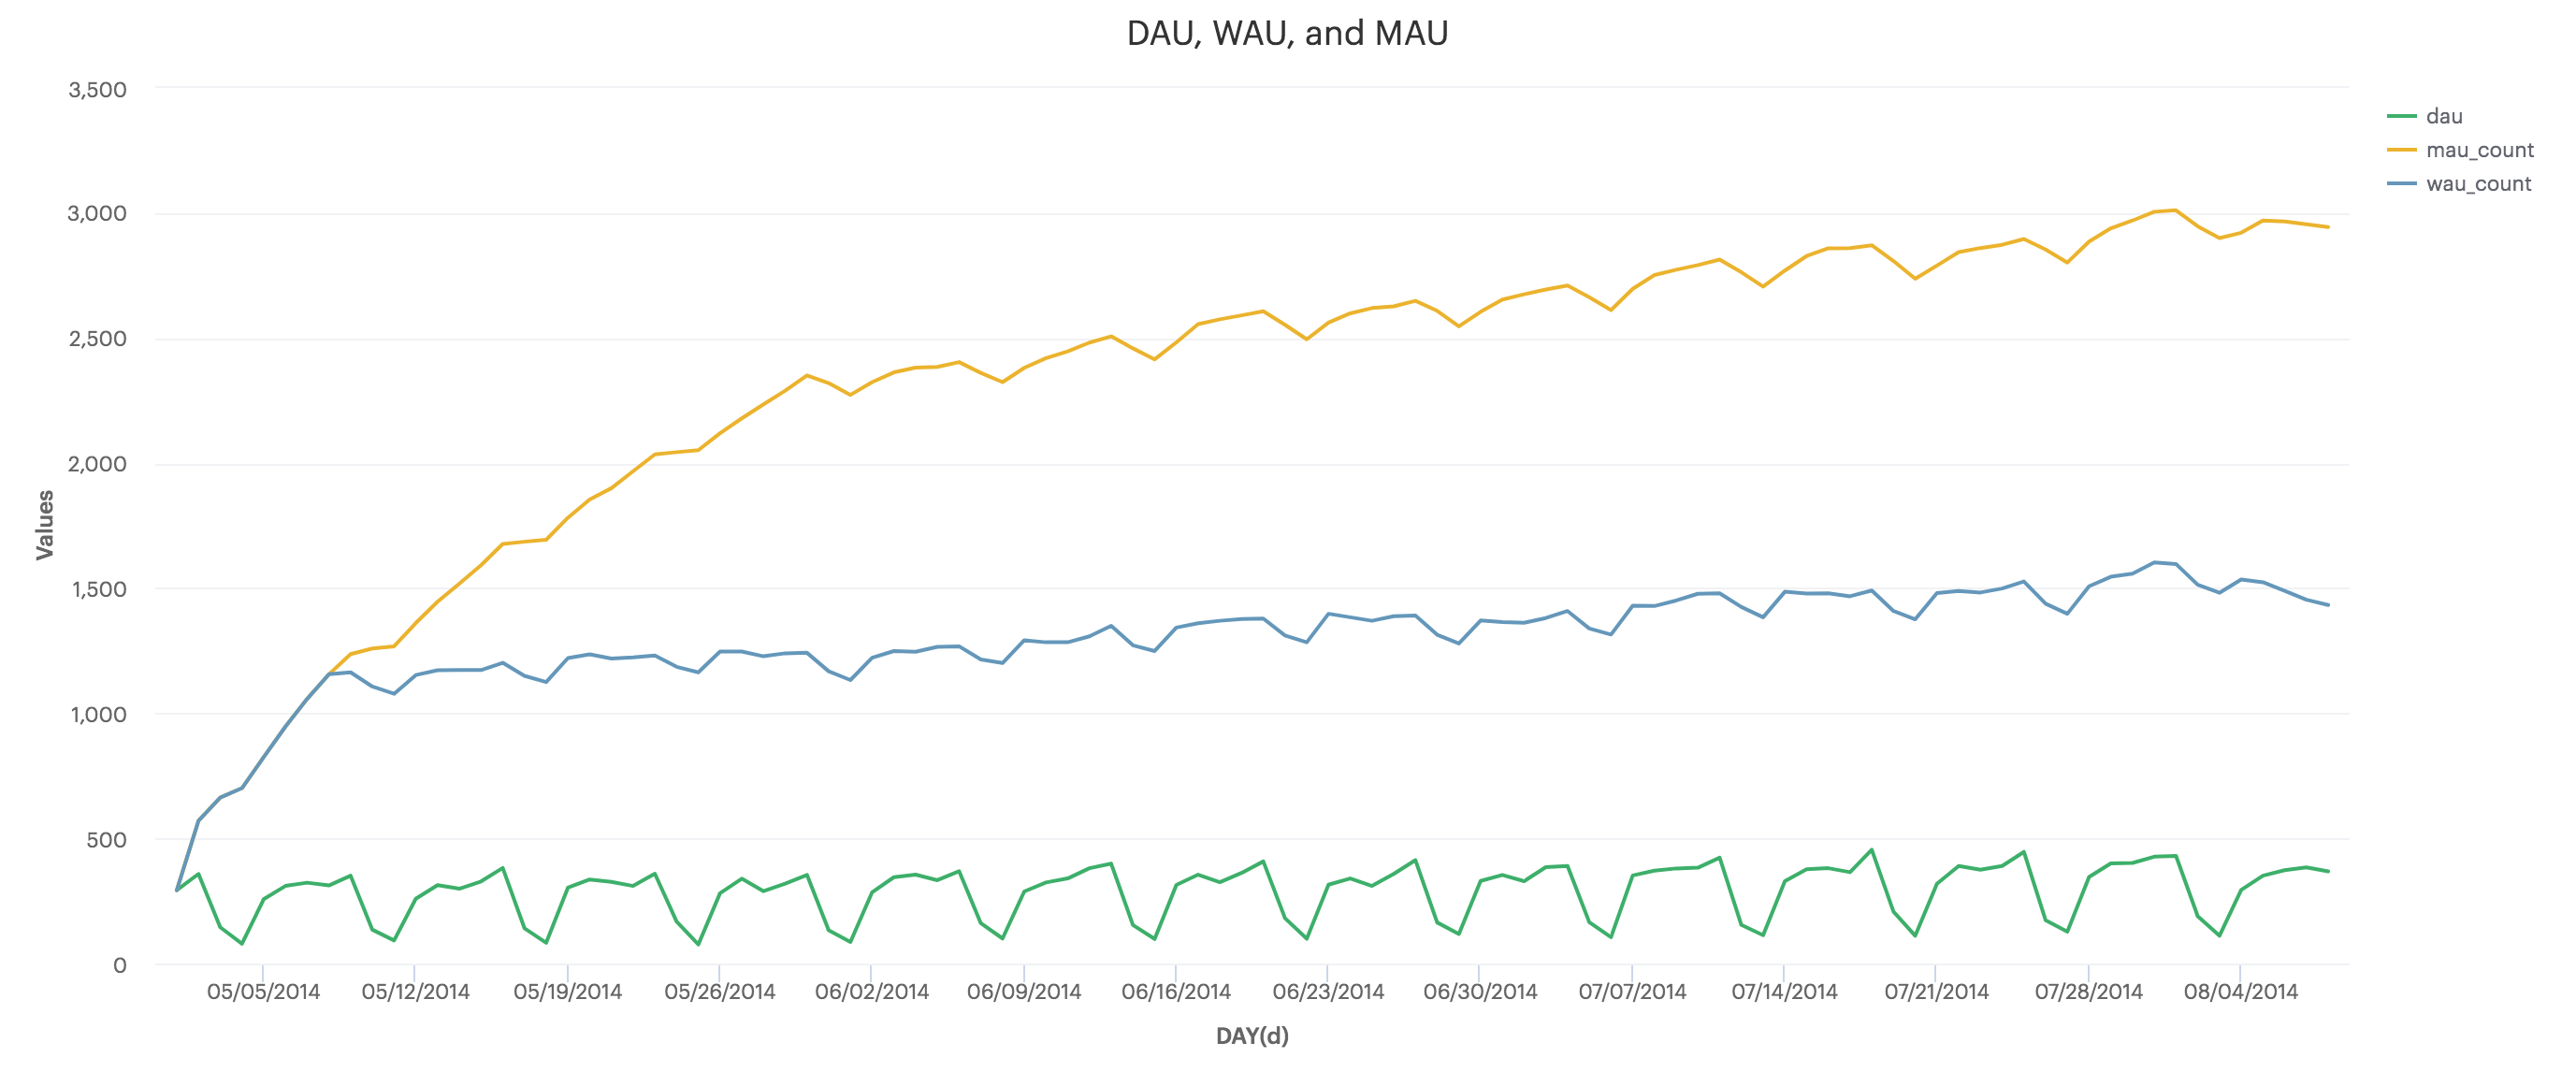
- Measure daily/weekly/monthly active users for adoption
- Track changes over time through cohort analysis
To easily reference these queries, I used Mode Analytics’s test data to compile the examples below. This article assumes some familiarity with SQL, but there are a lot of great SQL tutorial including this great one from Mode that can be referenced here.
Comparing test and control groups
To compare test and control groups in an A/B test we need two things, 1) a flag which we will use to group test and control data 2) the property whose behavior we expect to see change between the groups.
Let’s say, we were running an experiment where we updated our signup flow and wanted to see if there was a change in number of logins.
Assuming there was an explicit table tracking test and experiment group assignments, we could look at the results broken out by day by checking the condition of the flag:

However, there isn’t always an explicit table tracking experiment assignment. Frequently, there will be a single table that is used to capture properties all the properties so that we have the flexibility to record new properties without changing the tabel schema.
Let’s assume that a JSON property is being used to track all the flags that were enabled at the time of a given event, we can use that to group our results:

Click through rates
SQL allows doing simple arithmetic operations directly in the SELECT statement, which lets us calculate rates directly.
When you divide two integers, by default the result is also treated as an integer. When you are calculating a ratio of two integers, the default answer is usually a column of 0s. An easy way to get the right answer, is to multiply the ratio with a decimal number, such as 1.00, to implicitly cast the ratio to a float.
The query tends to be a little repetitive when we also show the underlying values, but my understanding is that we can’t reference another column in the SELECT statement. An alternative approach is to use WITH to deconstruct the query into subparts, for example


DAU, WAU, MAU, and ratios between them
To calculate active users, we need to define 1) what an active user is, 2) the groups we care about (DAU, WAU, MAU etc.). In this query, we are defining an active user as someone who logs in and the groups we care about as Daily, Weekly, and Monthly active users.
We will start by defining the smallest time range first, in this case the daily users, DAU.
For aggregating active users in other groups such as MAU, we will define the time ranges that we care about relative to the dates for the daily users group.
The time range will span between the current value for day in the DAU table, and we will use the Interval function to subtract the number of days that define the group to find the start of the range.
Putting it all together


Cohort analysis
A cohort is a group of users who share a similar characteristic. For us, we are interested in tracking the behavior of how engaged the cohort of users who activated in a given week are over a long period of time. We also want to compare that with cohorts who signed up in a different week, to see how the behavior in say Week 12 was different between a cohort who signed up in January vs June.
To do cohort analysis, we will do 3 things,
- Assign each user to a cohort based on the week they activated in.
- For each user, track which weeks they were active in. We are going to store the week number as a relative value so that we can compare across cohorts.
- Aggregate the user activity by cohort and the activity week to get a breakdown of how many users from a cohort were active after a given number of weeks.
1) Assign users to a cohort based on the week they were activated in

Store the cohort size so that we can determine the percentage of active users in a cohort later.

2) Track which weeks a user has been active in relative to their cohort start week

3) Putting it all together, aggregate user activity by cohort and the activity week to get a breakdown of how many users from a cohort were active after a given number of weeks.

What other metrics do you need to track frequently when launching a new feature?